%%{init: { "gitGraph": { "mainBranchName": "origin/main" } }}%%
gitGraph
commit id: "a1b2c3d"
commit id: "e4f5a6b"
branch main
branch alice/main
checkout alice/main
commit id: "7c9d2e1"
checkout origin/main
merge alice/main tag: "git push"
checkout main
commit id: "3f8a0c4"
merge origin/main tag: "git pull (conflict)"
commit id: "9b1e6d0"
checkout origin/main
merge main tag: "git push"
3 ML operations (MLOps)
3.1 Preview
In this unit, we will review how modern software delivery got to DevOps, what it is supposed to do, and what its core practices are. We’ll also see how cloud-native patterns emerge from the combination of DevOps and cloud computing.
Then we will talk about how these ideas extend to machine learning systems. Traditional DevOps focuses on code and infrastructure, but ML systems also have models and data that change over time. MLOps is the set of practices and tools we use to manage that full lifecycle: data, training, evaluation, deployment, and monitoring.
3.2 How we got here
We will start with a quick historical overview of approaches to developing and delivering software, and managing its lifecycle: waterfall, then agile, and then DevOps.
We want to understand which failure modes each approach was trying to fix, and why DevOps practices became so widespread.

3.2.1 Waterfall
In the Waterfall model, teams divide software development into sequential phases: requirements gathering, design, implementation, testing, deployment, and maintenance. The idea is that each phase produces deliverables that become inputs to the next phase. You gather all requirements upfront, freeze the design, code against that design, then test, and finally deploy once (or a few times).
Waterfall made sense when software was expensive and hard to change once built. If you were running a bank and needed to build a new system, you would invest heavily in planning: spend six months or a year gathering requirements, three months designing, three months building, three months testing, and then deploy it once. You would plan carefully because changing your mind later was costly.
The fundamental problem with this approach was an extremely long feedback loop. It takes a very long time to get something deployed, and an even longer time to iterate on it using feedback from the deployment. This makes it very hard to build systems that add value. There’s also a lot of “throwing things over the wall” where different teams own different phases, so knowledge and responsibility get lost at each handoff. When something goes wrong, it becomes easy for teams to blame the previous phase (“we implemented what you designed” / “it worked in testing”) instead of owning the problem end-to-end.
3.2.2 Agile
Agile arrived as a response to these Waterfall failure modes. Instead of one big release cycle with long phases, Agile proposes short cycles - “sprints” typically one to four weeks long - where you:
- prioritize a small amount of work that can fit in a sprint
- design, build, test, and deploy it (or at least complete it to a reviewable state)
- get feedback from users or stakeholders
- adjust priorities and repeat
This shorter cycle means you get feedback faster, and you can respond to changing priorities. You don’t have to guess what users want for six months; you can show them something in two weeks. The goal is to discover what you should build through iteration, not to be perfectly accurate upfront.
Agile changes how we plan and build (short iterations, frequent feedback), but this doesn’t address a fundamental structural problem in many organizations: the handoff between development and operations. Historically, these were separate teams with separate incentives. Developers were rewarded for shipping features and getting code into production quickly. Operations was responsible for keeping systems running, and was penalized when systems were unreliable. When developers shipped code with bugs or architectural problems, operations had to deal with the consequences: emergency pages at 3 AM, firefighting, manual patches.
This created a natural adversarial relationship. Developers wanted to ship faster; operations wanted to slow things down to reduce risk. Developers saw operations as gatekeepers preventing them from doing their job. Operations saw developers as reckless cowboys who did not care about reliability. This handoff dynamic - where developers could write code and then move on to the next feature without following through all the way to deployment - meant that nobody owned the full lifecycle of a feature. When something broke in production weeks after release, developers would have already moved on to other projects.
This also lengthens that feedback loop again, because even with very fast iteration cycles on your sprints, if it takes two weeks to test your code through operations’ testing environment, two weeks to get approval from a deployment review board, and another week to deploy because the deployment process is manual and error-prone, then fast sprints don’t translate into fast releases.
3.2.3 DevOps
DevOps (which merges “development” and “operations”) emerged from the realization that we can have both development velocity and operational stability. DevOps encourages a shared responsibility model, where the same team (and sometimes the same individual) is involved in shipping code all the way to production, and then maintaining it. This aligns incentives: we do not want to ship changes that make the system unreliable, if we are going to be the ones responding when something breaks.
But for this shared responsibility model to work, we need automation. Testing, approvals, and long deployment processes owned by strict gatekeepers exist because people don’t trust that changes are safe. DevOps solves this with automation:
- Automation makes shipping faster because there are fewer manual steps.
- Automation makes shipping safer because the same steps run the same way every time; we do not rely on a person to do it correctly.
- And automation also makes it safer to roll back quickly if something breaks, because the rollback process is also automated and well-tested.
Many organizations still have an operations or SRE function, but they have reliability as a shared responsibility instead of “someone else’s problem.” The SRE team helps the whole organization build and operate reliable systems by supporting incident tooling, monitoring/alerting platforms, logging pipelines, and sometimes shared operational infrastructure. But, the product teams still own their services: they write the code, fix bugs, and make the reliability tradeoffs (for example, cost vs redundancy).
Let’s make these ideas more concrete by walking through the core DevOps practices.
3.3 Core DevOps ideas
DevOps uses specific technical tools and practices that make it realistic for a team to own a service all the way to production: version control, Infrastructure and Configuration as Code, CI/CD automation, and monitoring and logging. We’ll discuss each of these conceptually and also with some technical detail.
3.3.1 Version control
Version control is critical for DevOps. Today, the most common version control framework by far is Git, so we’ll assume a Git environment.
In a DevOps environment, we often treat Git as the source of truth. That means the version in the repository is the reference point for what we intend to run. This gives us a stable operating model. If we want to understand what is deployed, we look at Git. If we want to change the system, we change Git. If we want to roll back, we roll Git back. Git defines the desired state, and then automation can apply it.
Suppose you store your application code in Git (hosted on GitHub, GitLab, or your own server). Now suppose you deploy the latest version of your application - whatever is in the “main” branch of Git - at 2 PM on Tuesday. At 3 PM, you notice that your application is running slowly. You check the logs and see errors related to a recent database query change. You could spend an hour debugging and trying to fix it while users are experiencing problems. Or, you could look at the Git log, see exactly which commit changed the database query, and revert that commit. The rollback takes two minutes, and the old code is back in production.
Compare that to a “hotfix” deployment where we SSH into the production server and patch it in place. We might change a config file, edit code, or run a command to tweak the database query. That feels faster in the moment, but it leaves us in a worse place: the production server is now running a state that is not captured anywhere. The next time we deploy from Git, we may overwrite the hotfix by accident. Or, if we later need to recreate the server, the hotfix is gone. If our hotfix accidentally introduced a new problem, the team can’t see it and debug it because the problem only exists on the production server. Version control helps us avoid this trap by making the fix reviewable, repeatable, and reversible.
Besides for application code, in a DevOps environment we may store many other materials in Git:
- infrastructure configuration
- deployment and runtime configuration
- documentation
- “runbooks” describing how to respond to incidents
etc.
Now that we understand why version control is so important in DevOps, let’s get into technical details of Git and how it works.
In Git, diffs (changes) move from our laptop to a shared codebase by running commands that move them between these four “areas”:
- Working directory is the files you are actively editing on your machine.
- Staging area is a deliberate snapshot of changes you want to include in the next commit on your machine.
- Local repository is the history of committed snapshots on your machine.
- Remote repository is the copy others can pull from and push to on a shared server. If you are using e.g. Github, then your remote repository exists on github.com.
This diagram illustrates a typical Git workflow, in which we change code in our working directory, stage it, commit to a local repository, and then push to the remote.

If we create a new repository on the Github web interface, we don’t even have a local copy yet. So we would start by copying a repository from the remote to our laptop. That initial copy is called a clone. The Github web interface gives us two options for an address to clone, using two different protocols:
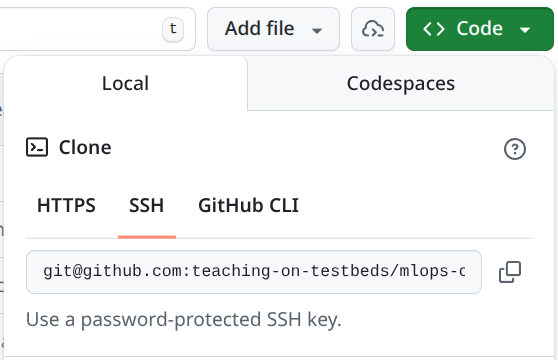
We use either one together with the git clone command:
# Clone using an SSH URL (common in teams)
git clone git@github.com:myorg/myrepo.git

# OR clone using an HTTPS URL (also common)
git clone https://github.com/myorg/myrepo.git
Both URLs point to the same repository, but they use different authentication methods.
With an SSH URL, Git authenticates using an SSH keypair. We generate a key on our laptop, add the public key to our Git hosting account (for example, GitHub), and then Git can prove it is us when we push.
With an HTTPS URL, Git typically authenticates using a token stored in a credential helper. One common way to set this up in a terminal is to use the GitHub CLI and log in once:
gh auth loginAfter that, Git can use those saved credentials for HTTPS pushes and pulls.
At that point, you would make changes in your working directory. When you are ready, you stage these changes to commit to the local repository, by using git add to add them to the staging area.
You want to be selective about what you are adding to the staging area, because Git is not useful for tracking “what has changed between these two deployments” if you include a lot of irrelevant material that is not really part of the change. For example, Macs automatically create .DS_Store files (Finder metadata) that you don’t want to track - it changes constantly and is only relevant on your local system. Similarly, Python creates __pycache__/ directories that shouldn’t be tracked. If you commit these, they create noise in diffs and make it harder to review and resolve conflicts.
As a rule of thumb, we also avoid adding these to any commit:
- Generated files: build outputs, caches, compiled artifacts, temporary editor files. These are easy to regenerate and create noisy diffs.
- Secrets: API keys, passwords, cloud credentials, private keys, and
.envfiles with sensitive values. If a secret is committed, assume it is leaked and you have to rotate it - remove it and generate new replacement secrets. - Large binary files: datasets, large model checkpoints, and other big blobs (for example
.zip,.tar,.parquet). Git can store them up to a certain size, but it cannot diff them meaningfully and repositories become slow to clone. Instead, we usually put large artifacts in some other type of durable storage, and keep references to them in Git (paths, versions, checksums).
We should never run git add . (or git add -A), which stages all changes in your current directory and its subdirectories - we should specifically add only the changes we want to include in the commit.
A practical habit to help avoid accidental commits of material that shouldn’t be added is a .gitignore. It lists patterns for files we do not want in version control.
For example, a .gitignore for a Python project might include:
# Mac
.DS_Store

# Python bytecode/cache
__pycache__/
*.pyc

# Secrets
.env

# Local notebooks/checkpoints and data/artifacts
.ipynb_checkpoints/
data/
artifacts/
You can use git add multiple times to add more changes to the staging area, and you can use git status at any time to see what is staged for commit.
Then, once you are ready, you would use git commit to turn the staged changes into a named checkpoint in the local repository history (with a commit message describing what changed and why). A commit is a safe checkpoint. Once something is committed, it has a unique ID (which will be generated automatically) and lives in the repository history. You can always go back to it, compare against it, or restore it. If a change causes a problem, you can revert the commit and immediately return to a known good state.
After that, you would probably want to copy your commit to the shared codebase on the remote with git push. But before you do, you might want to get the latest changes others may have made in the shared codebase into your local repository and working directory, and make sure that your new changes agree with them. You would do this with git pull.
If there is a merge conflict, Git marks the file with conflict markers like this:
config:
  timeout_seconds: 30
<<<<<<< HEAD
  retries: 3
=======
  retries: 5
>>>>>>> main
and you resolve it by editing the file to the version you want, deleting the conflict markers, and then committing the result:
git add path/to/conflicted-file
git commit -m "Resolve merge conflict"
at which point, you can push your changes to the remote:
git pushIn the visualization below, alice and I both start from the same commit, e4f5a6b, and pull it from the remote branch into our local main branches. alice makes a change, commits it as 7c9d2e1, and pushes it to the remote, so origin/main advances. Separately, I make my own change and commit it as 3f8a0c4 on my local main.
When I run git pull, Git tries to bring the new remote commit (alice’s 7c9d2e1) into my local branch. Because both of us edited the same lines, Git cannot merge automatically. I resolve the conflict, create a new commit with the resolution (9b1e6d0), and then I can push. At that point, the remote contains both our work: alice’s commit and mine.
In the simplest workflow (for example, a small project), we might pull from main, commit, and push straight back to main:
git checkout main
git pull

# Edit files, then stage and commit
git add path/to/file.py
git commit -m "Fix bug in X"

# Pull again before pushing, in case someone else pushed first
git pull
git push
But in larger projects, many teams use branches to work in parallel. A branch is a named line of history.
gitGraph
  commit
  commit
  branch develop
  checkout develop
  commit
  branch feature-a
  checkout feature-a
  commit
  checkout develop
  branch feature-b
  checkout feature-b
  commit
  checkout feature-a
  commit
  checkout develop
  merge feature-a
  checkout feature-b
  commit
  checkout develop
  merge feature-b
  checkout main
  merge develop
  commit
You create a branch to work on a feature or fix, commit changes there, and then open a pull request (PR) to propose merging it into the main branch. A PR is reviewed, and CI checks run automatically if configured. If the PR passes review and tests, it is merged, and the main branch moves forward. If something goes wrong after merge, the same system makes it easy to roll back by reverting the commit.
Here is what that looks like with concrete commands:
# Start from an up-to-date develop branch
git checkout develop
git pull

# Create a new feature branch
git checkout -b feature/my-change

# Edit files, then stage and commit
git status
git add path/to/file.py
git commit -m "Implement my change"

# Push the branch to the remote so others (and CI) can see it
git push -u origin feature/my-change
Before (or during) review, we usually merge the latest develop into our branch. This is often when merge conflicts show up, and we resolve them locally.
git fetch origin
git merge origin/develop
git add path/to/conflicted-file
git commit -m "Resolve merge conflict"
git pushThen we open a pull request, get review, and merge it into develop (in GitHub/GitLab). After the PR is merged, we update our local develop:
git checkout develop
git pull
Periodically, a team may merge develop into main to create a new release (as shown in the diagram above).
3.3.2 IaC/CaC
We mentioned above that in a DevOps environment, it’s not only application code for which version control is the “source of truth”. The same ideas will also apply to:
- infrastructure configuration
- and deployment and runtime configuration
Infrastructure as Code (IaC) means our infrastructure configuration (servers, networks, storage, managed services) lives in Git, is reviewed like code, and is applied by automation.
Configuration as Code (CaC) means our deployment and runtime configuration (for example Kubernetes manifests, environment settings) also lives in Git, is reviewed like code, and is applied by automation.
Without IaC, we would provision infrastructure by ClickOps. Clicking through a cloud console or running one-off CLI commands is fine for exploration and personal projects, but it does not scale as a reliable operating model when we need the changes to be reviewable (diffs), reproducible (apply the same config again), and reversible (roll back).
As before, imagine we make an infrastructure “hotfix” where we change something directly in the console to get unstuck. For example, suppose we realize a service needs to accept a new type of traffic, so someone adds a security group rule to an instance in production to allow it. The service starts working again, but we have created a new problem: the real infrastructure no longer matches what is in Git. If we later modify the instance, we might accidentally remove the rule (because it is not in the code), or we might recreate the environment and not include it, causing the same outage again. Worse, the change is not very visible, so we might accidentally open up more access than we intended and not even realize it. With IaC, the fix becomes a code change: we update the security group rule in the configuration, review the diff, apply it in a controlled way, and then the change is recorded so it can be repeated and rolled back.
Provisioning infrastructure is what is known as a Day 0 job. With IaC, we can do this Day 0 work “from scratch” any time, or we can update the deployed infrastructure incrementally when the configuration stored in Git changes.
But once the fundamental compute, storage, and networking building blocks are in place, we still have to configure the software and deployment environment on top of that infrastructure. This is Day 1: the first time we get the application running by installing dependencies, wiring configuration, and doing an initial deploy. We want everything needed for this work (deployment and runtime configuration) to also live in version control.
After the initial deploy, we have ongoing operations. Day 2 work includes routine upgrades, scaling, security patching, incident response, and iterative improvements. Throughout the lifetime of the application, we want the deployed configuration to match what is in version control. Where IaC gives us Day 0, CaC gives us Day 1, Day 2, and every day afterwards.
Let’s talk about some of the popular tools for IaC and CaC. For IaC, the tool that dominates the market is Terraform (and OpenTofu is a popular open source alternative).
Terraform is a command-line tool that we run on our own computer, or as part of a continuous integration workflow. It does not run “inside the cloud”. Instead, it talks to the cloud provider API over the network using our credentials, and asks the provider to create, update, or delete resources (instances, networks, security groups, load balancers, and so on).

In Terraform, we usually start by configuring our Terraform client with one or more providers. A provider is the component (a plugin) that knows how to talk to some external API, like AWS, GCP, or OpenStack. The provider defines what resource types exist (for example aws_instance or google_compute_instance) and what arguments they accept, and it uses our credentials to make the actual API calls. Terraform itself is the engine that reads our configuration, computes a plan, and then asks the provider(s) to create, update, or delete resources to match what we wrote in Git.
Terraform configuration is written in HCL (HashiCorp Configuration Language) and usually lives in one or more .tf files.
Here are example provider configurations for three clouds:
AWS:
provider "aws" {
  region = "us-east-1"
}
GCP:
provider "google" {
  project = "my-gcp-project"
  region  = "us-central1"
}
OpenStack (Chameleon-style, using a clouds.yaml entry):
provider "openstack" {
  cloud = "kvm@tacc"
}
In these examples, the provider block is where we tell Terraform “which cloud” and “which account/project” to act as. Authentication is usually handled outside the .tf file (for example, AWS credentials in the environment, GCP application default credentials, or OpenStack credentials in clouds.yaml). If credentials are saved in a file, they should never be added to version control.
Once we have set up a client with a provider and credentials, we can use it to work with our Terraform configuration. HCL is organized around blocks. A block has:
- a block type (like
resourceorvariable) - one or two labels (which identify what it is)
- a body in curly braces
{ ... }with arguments and sometimes nested blocks
Here are a few typical resource blocks that create a VM instance on different clouds. These are simplified examples (they show the shape of the configuration, not necessarily a complete, runnable setup).
The AWS example (EC2 instance):
resource "aws_instance" "web" {
  ami           = "ami-0123456789abcdef0"
  instance_type = "t3.small"

  subnet_id              = "subnet-0123456789abcdef0"
  vpc_security_group_ids = ["sg-0123456789abcdef0"]
  associate_public_ip_address = true

  tags = {
    Name = "web"
  }
}
In this block:
resourceis the block typeaws_instanceis the resource type (the kind of thing we are creating). The Terraform AWS provider defines the schema foraws_instance(which arguments it accepts and what they mean).webis a local name we choose so we can refer to it elsewhere
Here’s a similar example on GCP (Compute Engine VM):
resource "google_compute_instance" "web" {
  name         = "web"
  machine_type = "e2-medium"
  zone         = "us-central1-a"

  boot_disk {
    initialize_params {
      image = "debian-cloud/debian-12"
    }
  }

  network_interface {
    network = "default"
    access_config {} # allocate an external IP
  }
}
and an example on OpenStack of a VM instance with a reservation, like our Chameleon setup:
resource "openstack_compute_instance_v2" "web" {
  name       = "web"
  image_name = "CC-Ubuntu24.04"

  # On Chameleon, a reservation is represented as a specific flavor ID.
  flavor_id = "00000000-0000-0000-0000-000000000000"

  key_pair = "my-keypair"

  network {
    name = "sharednet1"
  }
}
The most common block types we will see are:
provider: how Terraform authenticates and talks to a cloud API (AWS, GCP, OpenStack, etc.).resource: something Terraform creates and manages (a compute instance, a network, a storage bucket).data: something Terraform looks up (reads) from the provider but does not create (for example, an existing security group, or an existing public network).variable: an input that we specify at runtime. There are multiple ways to set variable values. For example, we can pass-var region=...on the command line, put values in a.tfvarsfile, or set environment variables likeTF_VAR_region=....output: a value Terraform prints afterapply(for example, a public IP allocated by the provider, or a URL).locals: named expressions to avoid repeating ourselves.module: a reusable bundle of Terraform configuration (for example, a standard networking setup we use across projects).
In practice, we often use these block types together. For example, suppose we want to launch an OpenStack VM, but we want to (1) look up existing security groups by name (data) and (2) pass in the SSH key pair name as an input (variable). A simplified configuration might look like:
variable "key_name" {
  description = "Name of the OpenStack key pair to install on the VM"
  type        = string
}

# Look up existing resources (created outside of this Terraform config)
data "openstack_networking_network_v2" "sharednet1" {
  name = "sharednet1"
}

data "openstack_networking_secgroup_v2" "allow_ssh" {
  name = "allow-ssh"
}

data "openstack_networking_secgroup_v2" "allow_http_80" {
  name = "allow-http-80"
}

# Create a port that attaches to an existing network, with existing security groups
resource "openstack_networking_port_v2" "web_port" {
  name       = "web-port"
  network_id = data.openstack_networking_network_v2.sharednet1.id

  security_group_ids = [
    data.openstack_networking_secgroup_v2.allow_ssh.id,
    data.openstack_networking_secgroup_v2.allow_http_80.id,
  ]
}

# Create the VM and attach the port; key_pair comes from a variable
resource "openstack_compute_instance_v2" "web" {
  name       = "web"
  image_name = "CC-Ubuntu24.04"
  flavor_id  = "74bb90a0-fec6-45b8-ad8d-856b7491d0a3"
  key_pair   = var.key_name

  network {
    port = openstack_networking_port_v2.web_port.id
  }
}
The VM instance and the port are managed by Terraform, the network and the security group are pre-existing, and the variable is passed at runtime.
In a real repository, we will often see a Terraform directory that looks like this, where these items are organized into separate files:
tf/
├── main.tf        # resources
├── variables.tf   # input variables
├── outputs.tf     # outputs printed after apply
├── provider.tf    # provider configuration
└── versions.tf    # Terraform/provider version constraints
Terraform does not care about the filenames; it loads all .tf files in a directory and treats them as one configuration.
Here is what a typical Terraform workflow looks like, given some .tf files in a directory and a provider configuration:
# runs on our computer (or in CI)
terraform init

# checks that the configuration is syntactically valid
terraform validate

# gets real state from provider, shows what Terraform would change
terraform plan

# applies changes to the real cloud resources
terraform apply
We can also delete all the resources managed by Terraform:
terraform destroyNote that this does not destroy e.g. resources in data blocks - only those in resource blocks that Terraform itself is managing.
One important detail is that Terraform keeps a “state” file: a record of what resources it created and how they map back to the configuration. The state is created the first time we successfully run terraform apply. After that, every plan and apply uses the state in three ways:
- It remembers resource identities. For example, the state records “this
aws_instance.webcorresponds to EC2 instancei-...”. Without state, Terraform would not know which real resource to update or delete. - It makes diffs possible. Terraform compares the desired configuration (what is in
.tffiles) to the current state (what it believes exists), and also refreshes from the cloud API to see what actually exists. The plan is essentially “what do we need to change to make the real world match the desired config?” - It supports collaboration. In a team setting, we usually store the state in secure shared remote storage (with locking), so two people do not accidentally apply conflicting changes at the same time.
There are a few gotchas:
- State is sensitive. It can contain secret values, or at least secret details of system design. We should not commit state files to version control. Instead, we store state in a secured backend, and we use locking to prevent concurrent writes.
- Manual changes cause drift. If someone changes infrastructure “hotfix” style, Terraform may detect drift on the next run and try to “fix” it by reverting the change back to what is in code. That is good when the code is correct, but it can be surprising if the console change was intended. The safest way is to make changes in code and apply them through Terraform.
- Losing state is painful. If the state is deleted or corrupted, Terraform loses its map from config to real resources. Recovery is possible (for example by importing resources), but it is time-consuming and error-prone.
When IaC is used correctly, the .tf files are the canonical source of truth about what infrastructure you want. When you run terraform apply, it compares your desired state (in the file) with the actual state (what exists according to the cloud provider) and makes changes to match. If you commit these .tf files to Git, you have the same benefits as version control for code: you can see who changed what, when, and you can revert to a previous infrastructure configuration if something breaks.
IaC also enables reproducibility and reusability. If your Terraform files are correct, you can recreate your entire infrastructure in a different region, on a different cloud provider, or in a test environment, by running the same files.
Finally, IaC plugs into the application lifecycle. In a healthy DevOps setup, an infrastructure change is managed like a code change: we propose it as a pull request, review the diff, and apply it the same way every time. Like with code, we can use environments to reduce risk: apply to staging first, verify, and then apply to production. If a change breaks something, rollback is also a code operation: revert the config and apply again.
IaC tools like Terraform mostly cover the Day 0 side: provisioning cloud resources. CaC tools and artifacts often cover Day 1 and Day 2. One popular CaC tool is Ansible.
Ansible is a tool for configuring machines over the network. Like Terraform, it runs on our computer (or in CI). But instead of talking primarily to a cloud provider API, it usually talks directly to the servers we provisioned (most commonly over SSH). This makes Ansible a good fit for tasks like installing packages, writing config files, creating users, starting services, and rolling out application code or containers.

In Ansible, we typically start with an inventory. The inventory can be a simple text file listing IP addresses, or it can be generated dynamically from a cloud provider. We then write a playbook, which is a YAML file describing what we want to do on those hosts.
Here is a typical Ansible directory layout:
ansible/
├── ansible.cfg        # defaults (SSH user, key, etc.)
├── inventory.ini      # which hosts we target
├── site.yml           # the main playbook
└── roles/             # reusable bundles of tasks (optional)
The ansible.cfg file is where we can set defaults so we do not have to type them every time. For example, we often specify which SSH user to connect as, which private key to use, etc:
[defaults]
inventory = inventory.ini
remote_user = cc
private_key_file = ~/.ssh/id_rsa_chameleon
An inventory file might look like:
[web]
203.0.113.10

[workers]
203.0.113.11
203.0.113.12
The inventory can also be expressed in YAML:
all:
  children:
    web:
      hosts:
        203.0.113.10:
    workers:
      hosts:
        203.0.113.11:
        203.0.113.12:
And a basic playbook might look like:
- name: Configure web hosts
  hosts: web
  become: true
  tasks:
    - name: Install nginx
      ansible.builtin.apt:
        name: nginx
        state: present
        update_cache: true
The apt task above is one example of an Ansible module (a built-in building block). There are many modules for common operations, so we usually do not have to write shell scripts for basic system administration. In our IaC repository, we will see modules like:
systemd: start/stop/enable servicesfile: create directories, touch files, set permissionscopy: write a file onto the machineuser: manage users and group membershipgit: clone or update a repo on a machinecommandandshell: run commands when there is not a more specific module
Ansible tasks are usually written to be idempotent. In the example above, if nginx is already installed, Ansible does not reinstall it every time. This is important because we will run playbooks repeatedly: to set up a fresh machine, to roll out changes and upgrades, and to recover from partial failures by rerunning the same playbook until the system reaches the desired state.
The important idea is that we describe what we want (a service stopped, a file present, a user in a group), and Ansible applies it consistently across hosts.
Within a playbook, “dependencies” are usually expressed through ordering. Tasks run top-to-bottom, and later tasks can assume earlier tasks already ran on that host. For example, we create a directory before copying a file into it, we install a package before starting its service, and we write a config file before restarting a daemon to pick up the change.
There are a few common patterns for managing these dependencies:
- Split work into smaller playbooks or roles and include them in a consistent order.
- Use conditionals (
when:) so a task only runs when it is needed. - Use handlers for “do this only if something changed”. A task can
notifya handler, and the handler runs at the end of the play (for example, restart a service only if its config changed).
Here is a small example of the handler pattern:
- name: Configure a service
  hosts: web
  become: true
  tasks:
    - name: Write config file
      copy:
        dest: /etc/myservice/config.yml
        content: |
          setting: value
      notify: Restart myservice

  handlers:
    - name: Restart myservice
      systemd:
        name: myservice
        state: restarted
Once you have a playbook, you apply it:
# apply the playbook
ansible-playbook -i ansible/inventory.ini ansible/site.yml
Tools like Terraform and Ansible work together. Terraform provisions the servers and networking, and then Ansible connects to those servers to configure them. Sometimes you may “glue” them together, for example: take an IP address output from Terraform (for example a floating IP) and put it into the Ansible inventory, so that Ansible knows where to connect.
3.3.3 CI/CD
You will use tools like Terraform and Ansible to get the environment ready for your application, but to manage its actual deployment and updates, you will likely use CI/CD tools.
Continuous Integration and Continuous Deployment (CI/CD) is the backbone of modern software delivery. The idea is that every change to your codebase goes through an automated pipeline that tests it, builds it, and deploys it - rather than having
- developers manually test,
- someone separately building a release artifact,
- and then operations manually deploying.
Here’s what a typical CI/CD pipeline looks like in practice. A developer makes a commit and pushes it to a version control system like Git. A CI system (like GitHub Actions, Argo Workflows, or Jenkins) detects the push and runs a series of automated steps:
- The system checks out your code
- It runs unit tests to make sure small pieces of code work in isolation (fast, no real dependencies)
- It runs tools to check for style issues, security problems, or patterns that suggest the code might be hard to maintain
- It builds an artifact (a compiled binary, a container image, etc.)
- It optionally runs integration tests against the built artifact to make sure the pieces work together (often slower, and may involve real dependencies like a database or a running service)
- If all checks pass, the artifact is stored in a registry
From this point, the “continuous deployment” part takes over. Depending on your risk tolerance, you might automatically deploy to production. But in many organizations, deployment is staged to reduce risk. A typical path looks like:
- Staging: deploy the new version to an environment that looks like production, then run additional automated checks (integration tests, end-to-end tests, performance tests).
- Canary: deploy the new version to serve a small fraction of real users or traffic (for example 1%) while watching metrics closely (errors, latency, resource usage). If the canary looks healthy, expand it to more traffic.
- Production: roll out the new version to all users, with the ability to roll back quickly if metrics degrade.
and some of these promotions might require human approval. But, the deployment itself is automated: the same steps run every time, consistently.
There are two common ways to connect CI to deployment: push-based and pull-based.
In a push-based deployment, the CI system (for example, GitHub Actions) “pushes” changes into the environment. Concretely, a workflow can be triggered on merge to main, run tests, build and push a new image, and then deploy by running kubectl apply against Kubernetes.
If we use GitHub Actions, the workflow is described in a YAML file in the repository, usually under .github/workflows/. A typical setup looks like this:
- Add a workflow file like
.github/workflows/deploy.yml. - Choose a trigger (for example, on push to
mainafter a PR is merged). - Run tests and build artifacts.
- Deploy by applying manifests to the cluster.
Here is a concrete example. In this workflow, GitHub Actions runs tests, builds an image, pushes it to the Github container registry, and deploys the new version by applying Kubernetes manifests.
name: ci-and-deploy

on:
  push:
    branches: [main]

# If we want to push images to a registry, we may need explicit permissions.
permissions:
  contents: read
  packages: write

jobs:
  test:
    runs-on: ubuntu-latest
    steps:
      - uses: actions/checkout@v4
      - name: Run tests
        run: |
          python -m pip install -r requirements.txt
          pytest -q

  build:
    runs-on: ubuntu-latest
    needs: [test]
    steps:
      - uses: actions/checkout@v4
      - name: Log in to GHCR
        uses: docker/login-action@v3
        with:
          registry: ghcr.io
          username: ${{ github.actor }}
          password: ${{ secrets.GITHUB_TOKEN }}
      - name: Build and push image
        uses: docker/build-push-action@v6
        with:
          context: .
          push: true
          tags: ghcr.io/${{ github.repository }}/myapp:${{ github.sha }}

  deploy:
    needs: [build]
    runs-on: ubuntu-latest
    steps:
      - uses: actions/checkout@v4
      - name: Configure kubectl
        run: |
          echo "${{ secrets.KUBECONFIG_B64 }}" | base64 -d > kubeconfig
          echo "KUBECONFIG=$PWD/kubeconfig" >> "$GITHUB_ENV"
      - name: Deploy
        run: |
          kubectl apply -f k8s/
There are a few practical details hidden in this example:
First, runs-on: ubuntu-latest means GitHub runs the job on a fresh virtual machine it manages - on Azure, incidentally. Our code is checked out onto that VM, the steps run there, and then the VM is discarded. That means that we need to make sure the Github-managed runner has the access and credentials it will need.
It is also useful to understand how “variables” work inside a workflow. There are a few different kinds:
- Workflow expressions like
${{ github.sha }}are evaluated by GitHub Actions when it prepares a job. They let us refer to metadata (commit SHA, branch name, repo name) and to stored values like${{ secrets.KUBECONFIG_B64 }}. - Environment variables like
$KUBECONFIGexist inside the runner while commands are running. We can set them for a single step, for an entire job, or by writing to the special$GITHUB_ENVfile (as in the example) so later steps in the same job see them. - Secrets are stored in the repository settings and are injected at runtime (for example registry credentials or kubeconfig). We should treat them as sensitive: do not print them, and scope them as narrowly as possible.
Finally, note that this gives a lot of power to the CI system! That is convenient, but it also means we need to: protect who can modify workflows, lock down secrets, and limit the permissions of the deployment credentials so a compromise does not become a full cluster compromise.
As an alternative to a GitHub-hosted runner (for example, if our Kubernetes control plane is configured to only be available inside the cluster), a common alternative is a self-hosted runner. In that setup, we run the deploy job on a runner that lives in the same network as the cluster, so it can reach private endpoints. The tradeoff is that we now operate that runner as part of our production deployment path, and we have to manage it ourselves.
In a pull-based deployment, the cluster pulls the desired state from Git. A tool like Argo CD runs inside the cluster, watches a Git repository that contains e.g. Kubernetes manifests, and continuously reconciles the cluster to match what is in Git.

In this model, there are two common ways changes reach the cluster:
- We change the manifests directly (for example, update a Deployment to adjust replica count, or change the CPU and memory limits for a pod). Argo CD sees the Git change and applies it.
- We change application code, which produces a new build via CI (for example, a new container image). The CI pipeline then updates the manifest to point at that new image (for example, bumps the image tag), and Argo CD applies that manifest change.
3.3.4 Monitoring and logging
If version control is the foundation layer, IaC/CaC and CI/CD are automation layers above it, then monitoring and logging is the overlay that makes all that automation safe. The automation makes it possible to deploy changes fast, but if you’re going to do that, you need to know when problems occur, in order to be able to roll back. So, monitoring and logging is as essential for effective DevOps as version control.
At a minimum, you should collect metrics on:
Traffic measures how many requests your system is handling. This is your baseline: if traffic suddenly drops, something might be wrong. If traffic spikes, you might need to auto-scale.
Errors measures how many requests failed or returned an error. A spike in error rate is usually the first sign that something is broken.
Latency measures how long requests take to complete. If latency increases, users notice. This can indicate that a change introduced inefficiency, or that you are running out of resources.
Resource usage (CPU, memory, disk, network) tells you whether you are about to run out of capacity. If you are consistently at 90% CPU utilization, you will have little buffer for traffic spikes.
These signals are most useful when you look at them together. If traffic spikes, latency increases, and CPU hits 100%, you need to scale up resources. But if error rate spikes and latency increases, while traffic is normal and CPU is normal, then you know the problem is in your system or its dependencies.
Beyond metrics, you need logs as records of what happened: which requests were processed, which errors occurred, which parts of your code ran. A single metric - “error rate is 5%” - is not very helpful. But logs that show “database connection pool exhausted, queries timing out” tell you exactly what to fix.
In a DevOps environment, you also use these signals to support on-call: when an alert fires (for example, error rate exceeds 5%), someone is paged to investigate and fix the problem. Good monitoring means that the person on-call can quickly diagnose and respond.
3.3.5 DORA metrics
How do we know if DevOps is actually working? A team could be practicing some DevOps rituals - maintaining a CI/CD pipeline, storing infrastructure in version control - but still be shipping slowly, unreliably, or with high stress on the team.
The DORA metrics give us concrete ways to measure whether a team is actually improving on the outcomes that matter in real systems: shipping changes quickly, shipping safely, and recovering quickly when something breaks.
The four DORA metrics are:
Deployment frequency answers: how often does your organization deploy code to production (or release it to end users)? Over a time window of length \(T\), if you had \(D\) production deployments, then:
\[ DF = \frac{D}{T} \]
Lead time for changes answers: how long does it take to go from code committed to code successfully running in production? If you observe \(C\) changes in a window, and each change \(c\) has lead time \(LT_c\) (commit \(\rightarrow\) running in production), then:
\[ LTFC = \frac{1}{C} \sum_{c=1}^{C} LT_c \]
Time to restore service (often written as mean time to restore, \(MTTR\)) answers: how long does it generally take to restore service when a service incident (for example, an unplanned outage or service impairment) impacts users? If incident \(i\) has restore duration \(t_i\) and you observed \(I\) incidents, then:
\[ MTTR = \frac{1}{I} \sum_{i=1}^{I} t_i \]
Change failure rate answers: what percentage of changes to production (or released to users) result in degraded service and subsequently require remediation? If \(I\) incidents occurred in a window and there were \(D\) deployments, one direct way to compute the rate is:
\[ CFR = \frac{I}{D} \]
(If you want a percentage, report \(100\% \cdot CFR\).)
These four metrics give you a complete picture, because they capture two different goals at the same time:
First, deployment frequency (DF) and lead time for changes (LTFC) measure velocity. DF asks how often we ship. LTFC asks how quickly a change goes from “committed” to “running in production”. Together, they tell us whether we can move quickly.
Second, change failure rate (CFR) and time to restore service (TTRS) measure stability. CFR asks how often a change breaks something. TTRS asks how quickly we recover when something does break. Together, they tell us whether we can move safely.
We want both velocity and stability. Some teams ship very frequently but with a high failure rate - that is stressful and unreliable. Other teams ship safely but very slowly - that is frustrating and unresponsive. DevOps practices, when done well, are supposed to enable both: fast and safe shipping.
3.4 DevOps + cloud
DevOps is a set of habits for delivering software quickly and safely. Cloud computing gives us the infrastructure building blocks (compute, networking, storage) as self-service APIs. When we combine them, we get what people often call cloud native computing.
Cloud native computing emerges from the idea that “infrastructure” is no longer a small set of long-lived machines that we manually maintain. Instead, compute becomes an API object: we can create it, replace it, scale it up and down, and tear it down in minutes. That makes the DevOps ideas from the previous sections (version control, CI/CD, IaC, monitoring) much more powerful, because the system is designed to be automated.
This is often described as the shift from pets to cattle.
Before cloud computing, many teams practically had to treat servers like pets. If we bought a physical server and racked it in a data center, we would name it, configure it by hand, and keep it running for years. If it started behaving strangely, we would log in and “fix it” in place because replacing it was slow: it might require ordering new hardware, waiting for delivery, coordinating with a data center, and rebuilding the system. Even if we had virtual machines on-prem, capacity was limited by the hardware we already owned, so spinning up a fresh replacement machine was not always easy or fast.
In a cloud environment, elasticity and on-demand self service gives us a different option. Suppose a VM that runs our web service starts failing health checks after a bad deploy. In a pet mindset, we might SSH in, tweak config files, and try to patch it back to health because that machine feels special. In a cattle mindset, we do the opposite: we treat that VM as disposable. We deploy a known-good version to a fresh instance, send traffic to the healthy instances, and then terminate the broken one. We keep important state outside the instance, in durable storage and managed databases, so retiring the instance does not mean losing data.
This works especially well with DevOps, because in DevOps, version control and IaC tell us what “correct” looks like and make it easy to deploy new infrastructure from scratch. Similarly, CI/CD produces versioned artifacts we can deploy at will. Monitoring tells us whether the new instances are healthy. In combination, these practices make replacement the default recovery mechanism instead of manual repair.
3.4.1 Immutable infrastructure
In the “pet server” world, the fastest way to fix something is often: SSH in and patch the machine until it works again. In the cloud, we can do that, but when you have cattle it doesn’t scale. If you have 200 instances, you can’t rely on “the one person who knows what to type” to keep them healthy.
That’s the motivation behind immutable infrastructure. In the lecture, I described this as treating it like hotfixes are illegal: you don’t change production by logging in and tweaking things. The only allowed path is through the automation pipeline.
So instead of “SSH into the VM, change something, and then remember to capture it in Git later”, immutable infrastructure says: update code/config in version control, build a new versioned artifact, and replace what’s running.
It can feel slower when you’re thinking about “one broken machine”, but it is much safer when you’re operating at scale. This approach guarantees that “what’s deployed” always matches “what can be built from Git”.
3.4.2 Containers
Once you commit to “replace instead of repair”, you need replacements to be predictable. In other words: when you replace a cow, you want a new cow that behaves the same way.
That’s why cloud-native computing strongly encourages you to package workloads as containers. We already saw this idea earlier when we talked about CI producing an artifact: very often, that artifact is a container image.
A container image is a standardized, versioned way to capture “what needs to run at runtime”. If we can build it and run it in CI, then we can run exactly the same thing in staging and production. If it isn’t packaged in a container (or some other equally repeatable artifact), it’s much harder to make “replace the instance” safe.
Most commercial clouds offer managed container services. If you don’t have that, you can still run containers on top of VMs, and the key idea is the same: containers make deployments more reliable and repeatable.
3.4.3 Orchestration
If you only have one container, you can start it by hand. But the moment you have multiple replicas, rolling updates, failures, and multiple machines, you’re managing cattle at scale. You want a system whose job is: keep reality matching what you intended.
This is where orchestration comes in. Once you have more complicated workloads, you need an orchestrator to manage it in an automated way. At a high level, orchestration gives you:
- a way to say what should be running (desired state)
- a scheduler that picks where to run it
- controllers that notice when reality drifts and continuously nudge it back (reconciliation)
This is how “cattle” becomes an operating model: When a node dies, workloads get recreated elsewhere. When you update the desired state, the orchestrator rolls out the new version. When something ends up in a weird state, the orchestrator will replace it.
3.4.4 Declarative APIs
In a declarative approach, you describe the desired end state (“these instances should exist”, “this network should exist”), and the platform/tool figures out the actions needed to reach (and sometimes maintain) that state. In an imperative approach, you click buttons or run commands in a sequence and hope you can reproduce it later.
Declarative APIs pair well with DevOps because they give you a clean “statement of intent” you can keep in version control. Kubernetes manifests and Terraform configurations are classic examples: you define the desired end state, and you let the tool figure out the ordering and the diff.
Argo CD fits this same model: you don’t tell it “bring up this replica, now bring up that replica, now create this service”. It watches your manifests, figures out what should exist, and reconciles the cluster to match.
Ansible is a useful contrast. Ansible playbooks are more imperative: a sequence of steps that run in order. But they usually still work in cloud environments because good playbooks are idempotent: if you run them again, nothing bad happens—they skip the steps that are already done.
3.4.5 Microservices
The last major piece of “cloud native computing” is to design your application as a set of smaller, well-defined services.
Many cloud native systems are organized as microservices: instead of one giant container or one giant instance that everything runs on, you deploy the application in well-defined pieces that talk to each other over well-defined APIs.
For example, you might have a database service, a frontend service, and a worker service. Or in an ML system, you might have a separate model inference service.
This is often contrasted with a monolith, where we typically scale and deploy the application as one unit.
The benefit of microservices is that services can be developed, deployed, and scaled independently. For example, if you don’t need more instances of your frontend but you do need more instances of your model inference service, you can scale those separately. And if you need to replace or roll out one piece, you can do that without redeploying everything.
The cost is that we have built a distributed system. More network communication means more failure modes (timeouts, retries, partial outages) and more need for good observability. Microservices also increase the importance of networking and security: we need to decide which services can talk to which others, how they authenticate, and how traffic flows through the system.
3.5 DevOps + ML
DevOps gives us strong patterns for managing code and infrastructure:
But it does not fully tell us how to manage models and data. In an ML system, the behavior of the system depends not only on the code we ship, but also on the training data we use, the features we compute, and the model artifact we deploy.
For example, imagine we have a normal web service. CI can run unit tests, build an artifact, and deploy it. If we roll back to the previous commit, we usually get the previous behavior back.
Now consider a service with a model in the loop:
- Data is a moving dependency. The model was trained on a snapshot of data. If we retrain tomorrow, the data will not be identical: new records arrived, labels were corrected, and feature logic might have changed. “Rebuilding from scratch” is not a simple
git checkoutbecause the data has its own history. - The deployed artifact is not just code. The model weights are a large binary file (or a set of files). We need to store it, version it, and know exactly which model is running in production. If we deploy “the latest model” without a version, we may not be able to reproduce or roll back behavior.
- Evaluation is not a standard unit test. A model can pass unit tests (the code runs) and still fail in practice because accuracy dropped, bias changed, latency increased, or the model is unstable on a new slice of data. We need a consistent evaluation process: offline metrics, slice-based analysis, and sometimes online experiments.
- The system creates its own training data. User behavior in production generates the future training set (clicks, corrections, moderator actions). That creates feedback loops and delayed labels. Traditional DevOps does not tell us how to handle “the thing we deploy changes the data we later learn from”.
- Monitoring needs new signals. For a normal service, we monitor latency, errors, and resource usage. For an ML service, we also need to monitor data quality and model quality: are input distributions changing, are prediction distributions shifting, are we seeing unusual rates of low-confidence outputs, and when labels arrive, is predictive performance degrading?
There’s more. In many organizations, there is a “platform” team that supports reusable capabilities across the organization. DevOps and platform are closely related, because in a typical software setting, they’re supporting:
| Capability | What it supports |
|---|---|
| Online experimentation | Canary and shadow deployments; A/B testing. |
| Monitoring | Operational metrics (latency, throughput, resource use); detect data skew and model decay. |
| Pipelines | Orchestrate steps; run locally or in the cloud; trigger on demand, events, or schedules. |
| Version control | Store and version code and configs. |
which are fundamental requirements for DevOps.
But in an ML setting you need many more shared services:
| Capability | What it supports |
|---|---|
| Experimentation for ML development | Make it easy to prototype and reuse (for example notebooks); integrate with version control; track experiments; share and discover data, models, and results. |
| Data processing | Data versioning; transforms and feature engineering; structured and unstructured data; batch and streaming. |
| Model training | Train with common ML frameworks; customization; distributed training; accelerators; hyperparameter tuning and model search. |
| Model evaluation | Batch scoring on test data; custom metrics; slice-based metrics; compare models; bias and fairness checks; explainability. |
| Model serving | Low latency online serving; high throughput batch serving; autoscale; common serving frameworks; composite systems. |
| Online experimentation | Canary and shadow deployments; A/B testing. |
| Monitoring | Operational metrics (latency, throughput, resource use); detect data skew and model decay. |
| Pipelines | Orchestrate steps; run locally or in the cloud; trigger on demand, events, or schedules. |
| Model store | Manage lifecycle; register and version models; store metadata. |
| Model tracking | Track lineage and artifacts; integrate across tools. |
| Data/feature store | Share, discover, and reuse data; connect to data processing; reuse data pipelines. |
| Version control | Store and version code and configs. |
This brings us to the idea of MLOps. It is DevOps, plus the extra practices and tooling needed for data and models: versioning and lineage for datasets, reproducible training, model registries, evaluation, safe rollout patterns for model changes, and continuous monitoring of both system health and model behavior.
3.5.1 MLOps framework
MLOps gives us a framework for applying CI/CD to ML systems. A typical lifecycle within an MLOps framework1 might look like this:

Each stage has a clear output, and we want to automate the handoffs so we can run the loop repeatedly and safely. Across all of these stages, there is also a data engineering layer “over the whole thing.
- ML development environment → output: training code + configuration. This is where you experiment and iterate (often in notebooks). Eventually, you end up with version controlled training code/config.
- Operationalization → output: pipeline specification. You operationalize the training code by making training runnable in an automated environment. The pipeline specification must clarify which framework/runtime it needs, what resources it needs, and how the steps should run.
- Automated training pipeline → output: versioned model artifact + metadata. A pipeline takes code/config plus a data snapshot and produces a model artifact, then records what produced it (data version, code version, metrics).
- Model deployment → output: a deployable serving package (often a container image). The CI/CD system packages the model with whatever serving/runtime dependencies it needs and prepares it for deployment.
- Prediction serving → output: predictions + logs/metrics. In production, the serving system makes predictions for the product. It takes produces logs and metrics for monitoring, but the production system also produces data that will become part of the overall data layer.
- Monitoring → output: decisions/triggers. Monitoring turns logs/metrics (and labels) into alerts, rollbacks, and sometimes automated retraining triggers.
3.6 System design
When we design an ML system, we have to ask how the system behaves over time, and how the automation makes it safe to operate and change. For example:
- What are the inputs and outputs of each stage (code/config, data snapshot, model artifact, serving package, predictions, metrics)?
- What is the source of truth for each stage (Git, dataset versions, model registry)?
- What is the evaluation or review process at each stage?
- What events should trigger automation (merge to
main, new labeled data, a schedule, a monitoring alert)? - How do we roll back safely (previous model version, previous serving package, feature flag)?
- What do we log, and where do the logs/metrics go (for debugging, audits, delayed labels, monitoring)?
- Which failures should self-heal automatically, and which should page a human?
3.7 Key terms
- .gitignore: A file that tells Git which files and directories to ignore so they are not accidentally committed.
- cattle: A mindset where servers are replaceable; if one is unhealthy, we replace it instead of repairing it by hand.
- ClickOps: Managing infrastructure by clicking around in web consoles and making manual changes that are hard to review, reproduce, and roll back.
- cloud native computing: A style of building and operating systems that combines DevOps practices with cloud infrastructure: automation, replaceable compute, containers, and managed services.
- configuration as code (CaC): Describing deployment/runtime configuration as version-controlled files applied consistently by automation.
- day 0: Initial infrastructure setup: creating the cloud resources we need so an application can run.
- day 1: First deployment and initial configuration of software on top of the infrastructure.
- day 2: Ongoing operations after the system is running: upgrades, scaling, incident response, and continuous improvement.
- declarative: A management style where we describe the desired end state, and the system figures out how to reach and maintain it.
- DORA metrics: Four metrics from DevOps Research and Assessment (DORA) used to measure software delivery performance.
- HCL: HashiCorp Configuration Language: a human-readable configuration language used by Terraform to describe infrastructure.
- idempotent: Safe to run multiple times; if the desired state is already true, running again does not keep changing the machine.
- immutable infrastructure: A replacement approach where we do not patch machines in place; changes happen by building a new versioned artifact and replacing the running instances.
- imperative: A management style where we issue step-by-step commands (how to do it), and the system performs those actions once.
- infrastructure as code (IaC): Describing cloud resources (compute, networking, storage, managed services) as version-controlled configuration applied by automation.
- inventory: A list of machines Ansible can connect to, organized into groups, with access details.
- merge conflict: When Git cannot automatically merge two branches because of incompatible edits to the same part of a file.
- microservices: An architecture where an application is split into multiple small services that communicate over the network and can be deployed independently.
- MLOps: The extension of DevOps ideas to machine learning systems, including managing data, models, evaluation, deployment, and monitoring over time.
- monolith: An architecture where most application functionality is packaged and deployed as a single service.
- pets: A mindset where servers are treated as long-lived machines that we name and nurse back to health.
- playbook: A YAML file describing a set of steps (tasks) to apply to a set of hosts.
- pull-based deployment: A deployment model where an agent running inside the target environment pulls desired state from Git and continuously reconciles to it.
- push-based deployment: A deployment model where a CI system actively applies changes to the target environment (for example, by running
kubectlor calling a cloud API). - self-hosted runner: A GitHub Actions runner you install and manage yourself; jobs run on that machine instead of on GitHub-hosted infrastructure.
- source of truth: The canonical, authoritative record of what the system should be: code, configuration, and infrastructure definitions.
Khalid Salama, Jarek Kazmiercczak, and Donna Schut. 2021. Practitioners guide to MLOps: A framework for continuous delivery and automation of machine learning. Google Cloud. https://services.google.com/fh/files/misc/practitioners_guide_to_mlops_whitepaper.pdf↩︎